Graph Generator v1.0
Update v1.1: Improved algorithm to approximate roots
Forum topic
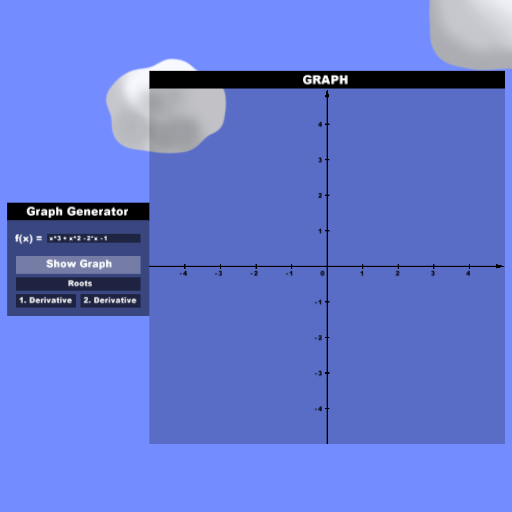
With this scene you can visualize mathematical functions. Next to "f(x) =" just type any function you want into the text box (make sure to use normal formatting like in the examples below). After that you can draw the graph, show it's roots, draw the first or second derivative.
As an example I already entered a function to the text box.
How to:
1) Start the simulation (press
SPACE)
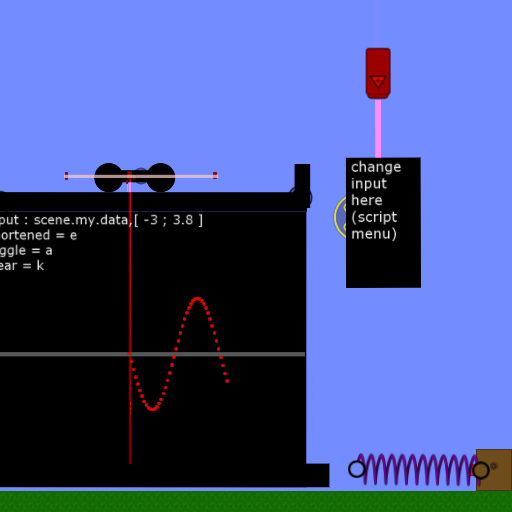
2) Select the text box next to "f(x) =" and go to it's appearance menu.
3) Now change the box text. Type in your desired function (or just keep the example function)
4) Close the appearance menu. Navigate with the
ARROW KEYS within the menu. Choose with
ENTER
Controls:
Arrows - Navigate
Enter - Choose
D - delete graph
Function types: (examples)
2*x -3
x^5 - 2*x^4 - 3*x^3 + 2*x^2 + x - 0.25
1/math.sin(x)
math.cos(x) -x
3^x -1
math.tan(x)
math.sin(math.cos(x))
x^2 - 2^x
x^0.5
Because Algodoo has no implemented ln I made my own ln. To use it type "scene.my.ln()"
scene.my.ln(x^2 +1)
Credits:
Thanks to gradyfitz and standardtoaster for having an answer to scripting questions all the time related to this scene and to immibis for his extended for-function.


.png)


