|
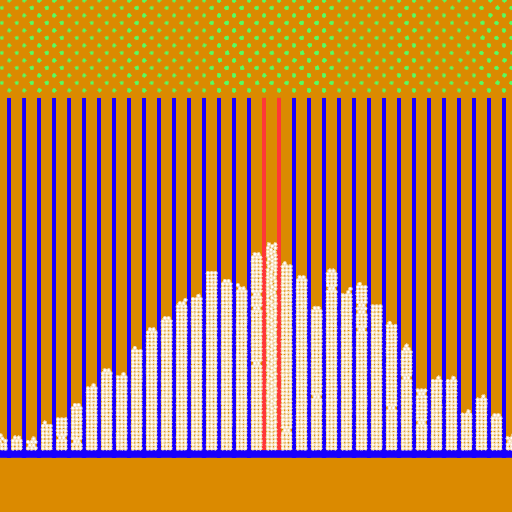
Title: Statistics - Galton board (bean machine)
Rating: 5
Filesize: 204.32 kB
Downloads: 1259
Comments: 0
Ratings: 1
Date added: 2011/05/04 11:26:29
Made with: Algodoo before v1.8.5
Rating: 
|
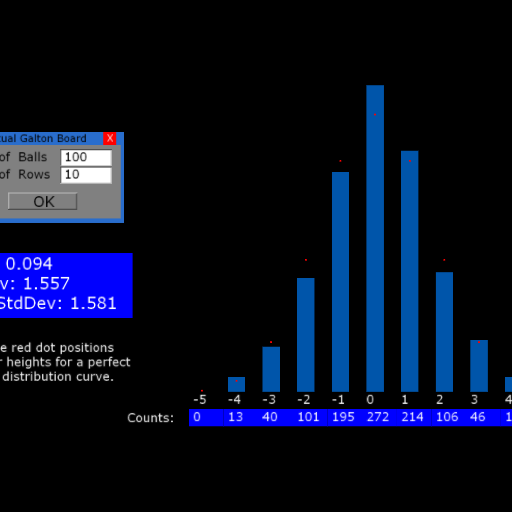
Title: Single Ball Galton Board
Rating: 5.625
Filesize: 253.84 kB
Downloads: 5949
Comments: 20
Ratings: 2
Date added: 2024/03/19 21:35:16
Made with: Algodoo v2.1.0
Rating: 
|
Title: marble run
Rating: 5
Filesize: 69.52 kB
Downloads: 661
Comments: 0
Ratings: 1
Date added: 2018/09/21 07:25:27
Made with: Algodoo v2.1.0
Rating:
|
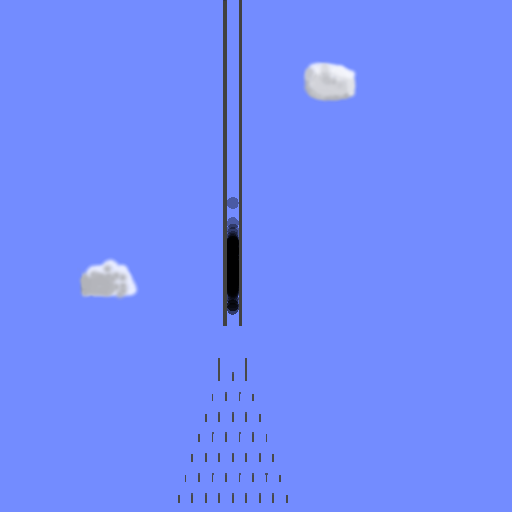
Title: The Bell Curve
Rating: 7.3571
Filesize: 46.18 kB
Downloads: 91065
Comments: 17
Ratings: 8
Date added: 2009/08/18 04:10:52
Made with: Phun
Rating: 
|
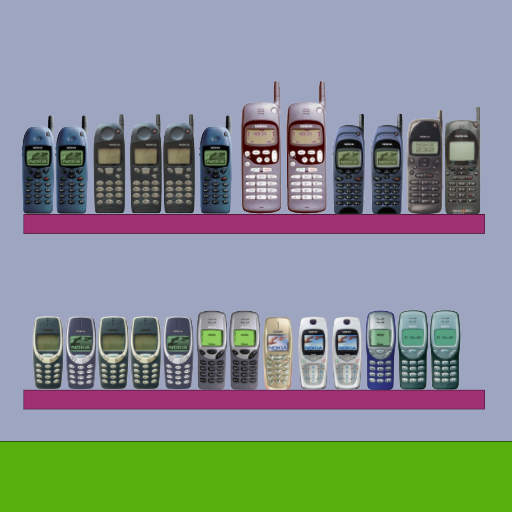
Title: Virtual nokia collection
Rating: 5
Filesize: 6.85 MB
Downloads: 3648
Comments: 1
Ratings: 1
Date added: 2019/10/13 04:55:40
Made with: Algodoo v2.1.0
Rating:
|
Title: virtual buddy
Rating: 4.5
Filesize: 1.86 MB
Downloads: 1781
Comments: 1
Ratings: 2
Date added: 2009/06/09 19:46:04
Made with: Phun
Rating:
|