|
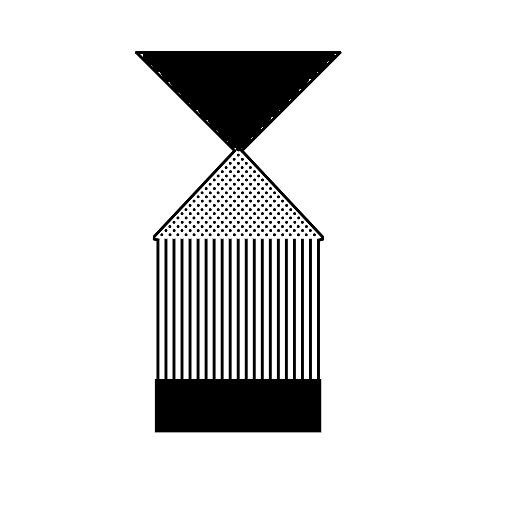
Title: Galton Board
Rating: 5
Filesize: 28.79 kB
Downloads: 384
Comments: 2
Ratings: 1
Date added: 2018/06/09 19:35:02
Made with: Algodoo v2.1.0
Rating: 
|
Title: Galton board
Rating: 5
Filesize: 154.71 kB
Downloads: 588
Comments: 0
Ratings: 1
Date added: 2024/03/17 15:02:48
Made with: Algodoo v2.1.0
Rating:
|
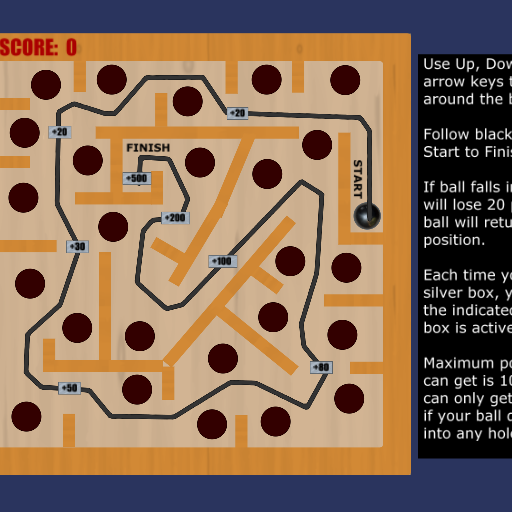
Title: Ball Balance Game
Rating: 6.3
Filesize: 383.08 kB
Downloads: 1598
Comments: 5
Ratings: 4
Date added: 2014/01/25 07:55:09
Made with: Algodoo v2.1.0
Rating: 
|
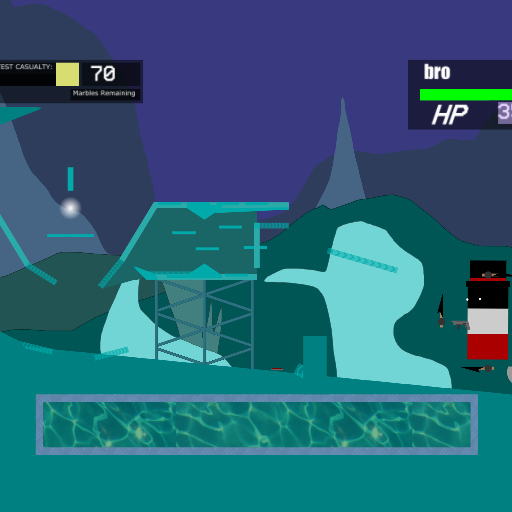
Title: bro - Marble Siege
Rating: 5
Filesize: 1.32 MB
Downloads: 2370
Comments: 0
Ratings: 1
Date added: 2024/10/19 03:01:34
Made with: Algodoo v2.1.0
Rating:
|
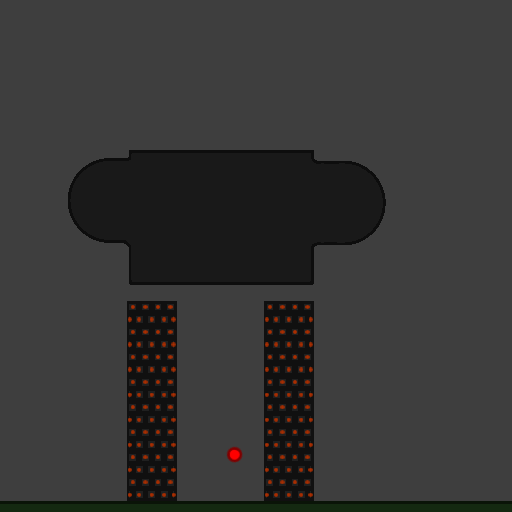
Title: Scripted Bomb
Rating: 5.8889
Filesize: 22.84 kB
Downloads: 1418
Comments: 4
Ratings: 3
Date added: 2010/03/08 17:10:15
Made with: Phun
Rating:
|
Title: bALL GAME
Rating: 5
Filesize: 267.94 kB
Downloads: 426
Comments: 0
Ratings: 1
Date added: 2014/10/04 13:17:09
Made with: Algodoo v2.1.0
Rating:
|