Browse Search Popular Register Upload Rules User list Login:
Search:
Heat Transfer Thru Fin

Image:
screenshot of the scene

Author: s_noonan

Group: Default

Filesize: 113.37 kB

Date added: 2022-11-19

Rating: 5.6

Downloads: 2202

Views: 315

Comments: 3

Ratings: 2

Times favored: 1

Made with: Algodoo v2.1.0

Tags:
heat

Scene tag

Heat Transfer Thru Fin

Rev A: New Hinges.
Last edited at 2022/11/24 07:25:45 by s_noonan
Please log in to rate this scene
edit
Similar scenes
Title: Heat Transfer with Thermal Expansion
Rating: 6.5
Filesize: 0.66 MB
Downloads: 1303
Comments: 4
Ratings: 4
Date added: 2013/04/30 00:08:17
Made with: Algodoo v2.1.0
Rating: rated 6.5
download
Title: Lumped System Heat Transfer
Rating: 5
Filesize: 66.77 kB
Downloads: 512
Comments: 2
Ratings: 1
Date added: 2022/10/30 10:29:02
Made with: Algodoo v2.1.0
Rating: rated 5
download
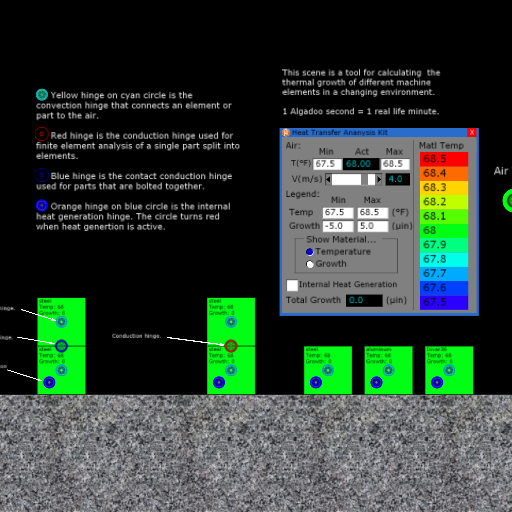
Title: Heat Transfer Analysis Kit
Rating: 5
Filesize: 490.37 kB
Downloads: 402
Comments: 7
Ratings: 1
Date added: 2022/11/13 15:27:19
Made with: Algodoo v2.1.0
Rating: rated 5
download
Title: Marble Camp Season 1 Heat 1 Update 11
Rating: 5
Filesize: 0.98 MB
Downloads: 235
Comments: 4
Ratings: 1
Date added: 2015/07/05 11:43:44
Made with: Algodoo v2.1.0
Rating: rated 5
download
Title: my united states episode 3: arizona
Rating: 5
Filesize: 72.33 kB
Downloads: 988
Comments: 1
Ratings: 1
Date added: 2021/07/19 22:44:40
Made with: Algodoo v2.1.0
Rating: rated 5
download
Title: MAGNEHAND level 5
Rating: 6.1111
Filesize: 253.28 kB
Downloads: 468
Comments: 1
Ratings: 3
Date added: 2009/11/08 15:35:32
Made with: Algodoo before v1.8.5
Rating: rated 6.1
download
I noticed that the Y-axis values on the thermal growth plot keep changing in order to display the updated magnitudes and range of values. Then after a couple of real-time minutes, the Y-axis values plot outside of the graph, and then shortly after that, the values disappear. Would the plot be more useful if the Y-axis was logarithmic?
Q: Would the plot be more useful if the Y-axis was logarithmic?
A: I don't think so. Logarithmic scales are typically used for very wide ranges. In this case the range is too small. If the value doesn't change in 30 seconds then the auto-scaling max and min become equal and the plot disappears. I need to set a default minimum range.
Yup, good fix. :tup: